Overview
While the U.S. Drought Monitor is a vital tool for many sectors, participation in the USDM network of local experts is primarily voluntary and varies by state. The following fact sheets are intended to serve as a resource for new and existing local experts in states located within and bordering USDA’s Northwest Climate Hub region. States looking to start or revise a coordinated recommendation and feedback process for the USDM may also find these fact sheets useful.
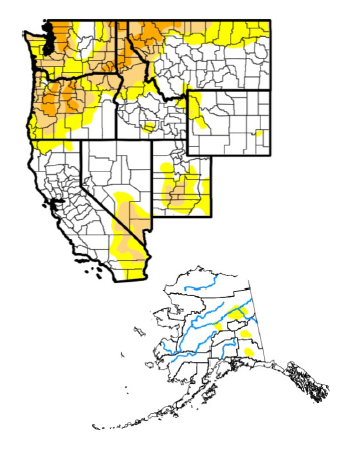
The USDM is a map, released every Thursday, showing the extent and severity of drought conditions. The map uses six classifications: None, meaning normal or wet conditions; abnormally dry (D0), showing areas that may be going into or are coming out of drought; and four levels of drought: moderate (D1), severe (D2), extreme (D3) and exceptional (D4).
The map is a joint product of the National Drought Mitigation Center (NDMC) at the University of Nebraska-Lincoln, the National Oceanic and Atmospheric Administration and the U.S. Department of Agriculture (USDA). Each week, a drought expert from one of these partner agencies analyzes new data for the map’s weekly update.
The USDM stands apart from other drought monitoring tools in that it relies on the knowledge and experience of the author, along with a nationwide network of 450-plus local experts, to analyze and interpret physical data. Data — such as precipitation, streamflow, reservoir levels, soil moisture, temperature and evaporative demand, and vegetation health — don’t always tell the full story of what drought looks like on the ground. During their analysis, authors may encounter data gaps, sensor errors and bias, delays in data processing and delivery, inconsistent drought signals at different timescales and other issues.
That is why the USDM is not solely a product of statistics, machine learning or artificial intelligence. While data drive the drought depiction, the collective judgment of the authors and expert network is what makes the USDM the “gold standard” of drought monitoring. Together, they help give the data context, identify what’s important and provide valuable insight that can’t be gained from data alone.
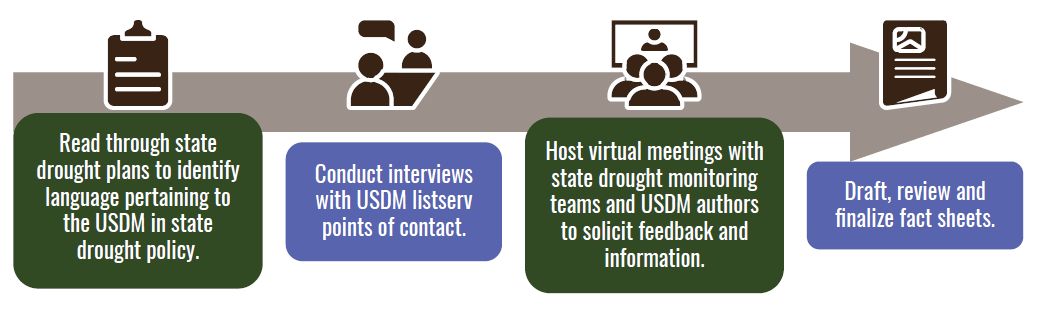
Our Methodology
Contents
This guide is designed as a series of fact sheets, which include the following:
Acknowledgements
This project was made possible through a partnership with the U.S. Department of Agriculture Northwest Climate Hub, with funding provided by the USDA Office of the Chief Economist. Special thanks to the Alaska, Washington, Oregon, Idaho, Montana, Wyoming, Utah, Nevada and California state drought monitoring teams for participating in interviews, attending our virtual workshop and reviewing materials. We’d also like to thank the U.S. Drought Monitor and Canadian Drought Monitor authors for the input and feedback. Finally, thanks to staff from the National Integrated Drought Information System for assisting with workshop preparation, facilitation, and reviewing materials.
Questions or comments?
Please contact Deborah Bathke, NDMC education and outreach specialist: dbathke2@unl.edu.